Net worth for people aged 30–33 in Raleigh
Total assets minus total debts — bank accounts, investments, retirement accounts and home equity, less mortgages, loans and cards.
Half of people aged 30–33 in Raleigh have a net worth above $70,720. Reaching the upper quarter takes about $245,152, and the top 10% starts at $462,000 — roughly 6.5× the median. The lower quarter sits below $7,361, and the bottom 10% is negative — more owed than owned.
The full distribution
| Percentile | Net worth | What it means |
|---|---|---|
| Bottom 10% | −$5,687 | 9 in 10 are above this |
| Lower quarter | $7,361 | 25th percentile |
| Median | $70,720 | half above, half below |
| Upper quarter | $245,152 | 75th percentile |
| Top 10% | $462,000 | only 1 in 10 is above this |
| Average (mean) | $91,936 | pulled up by the top end — the median is the better "typical" |
Get this cohort's numbers when they move.
One email on the 1st: the median and top-10% net worth for people aged 30–33 in Raleigh, what changed since last month, and how many members joined. No account, no spam, one-click unsubscribe.
You'll get the current figures right away, then monthly. Keeping Up Inc, New York. Privacy.
This page is the cohort. An account puts you on it.
- Your rank, kept current. Type a rough net worth and your percentile sits on your dashboard, moving as the cohort does.
- Six ranks, not one. Net worth, income, savings rate, spending, retirement and investments against people aged 30–33 in Raleigh.
- Exact when you want it. Connect accounts read-only later for the real number; nothing is required to start.
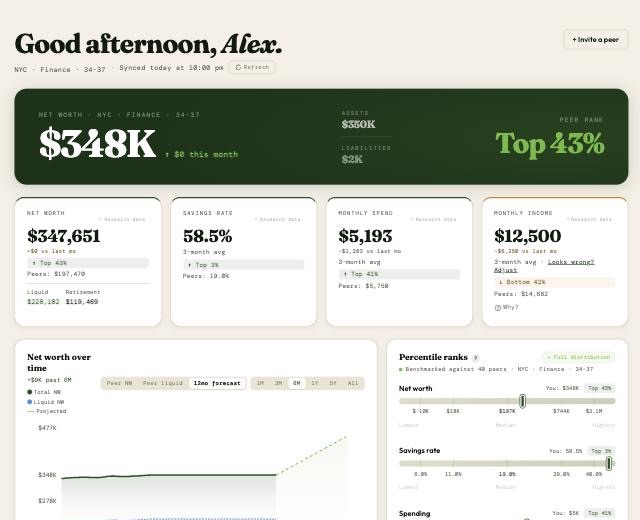
Just want the number? Try the percentile calculator — no signup, and the number you type never leaves your browser.
Net worth by age in Raleigh
| Age | Lower quarter | Median net worth | Upper quarter | Top 10% |
|---|---|---|---|---|
| 22–25 → | $1,140 | $17K | $75K | $221K |
| 26–29 → | $3,318 | $41K | $138K | $331K |
| 30–33 | $7,361 | $71K | $245K | $462K |
| 34–37 → | $9,539 | $102K | $370K | $966K |
| 38–41 → | $21K | $168K | $527K | $1.3M |
| 42–45 → | $39K | $213K | $678K | $1.7M |
| 46–50 → | $45K | $239K | $866K | $2.6M |
| 50–54 → | $57K | $265K | $1.0M | $3.1M |
| 55–59 → | $60K | $328K | $1.3M | $3.3M |
| 60–64 → | $109K | $463K | $1.4M | $3.7M |
| 65 and over → | $142K | $504K | $1.5M | $4.1M |
Net worth at 30–33 by city
| Metro | Lower quarter | Median net worth | Upper quarter | Top 10% |
|---|---|---|---|---|
| New York City → | $9,060 | $88K | $311K | $605K |
| San Francisco → | $10K | $99K | $349K | $688K |
| Los Angeles → | $8,406 | $82K | $286K | $550K |
| Chicago → | $7,753 | $75K | $260K | $495K |
| Boston → | $8,276 | $80K | $281K | $539K |
| Washington, DC → | $8,406 | $82K | $286K | $550K |
| Seattle → | $8,537 | $83K | $291K | $561K |
| Austin → | $7,884 | $76K | $265K | $506K |
Net worth at 30–33 by industry
Net worth at 30–33 in other metros
More for people aged 30–33 in Raleigh
Common questions
How this is built. Percentiles are modeled for this cohort from federal survey microdata — the Federal Reserve's 2025 Survey of Consumer Finances (released October 2026), the BLS Consumer Expenditure Survey (2024), the Census American Community Survey and BLS Occupational Employment & Wage Statistics (May 2025) — with metro cost-of-living and wage adjustments. As Keeping Up members in this cohort grow, the band blends toward anonymized, aggregated live data (minimum cohort sizes apply; no individual is ever identifiable). Seeded figures are household-level, as in the SCF; live cohorts are individual-level. Amounts are in current dollars. Read the full methodology.
Last updated October 2026. Cohort: people aged 30–33 in Raleigh. Model sample basis: 120.